Monitoring
Monitoring allows you to visualize and quantify the performance and traffic of your projects on Vercel. You can use example queries or create custom queries to debug and optimize bandwidth, errors, performance, and bot traffic issues in a production or preview deployment.
Monitoring is available on Pro and Enterprise plans
Those with the owner, member, developer role can access this feature
Charts allow you to explore your query results in detail. Use filters to adjust the date, data granularity, and chart type (line or bar).
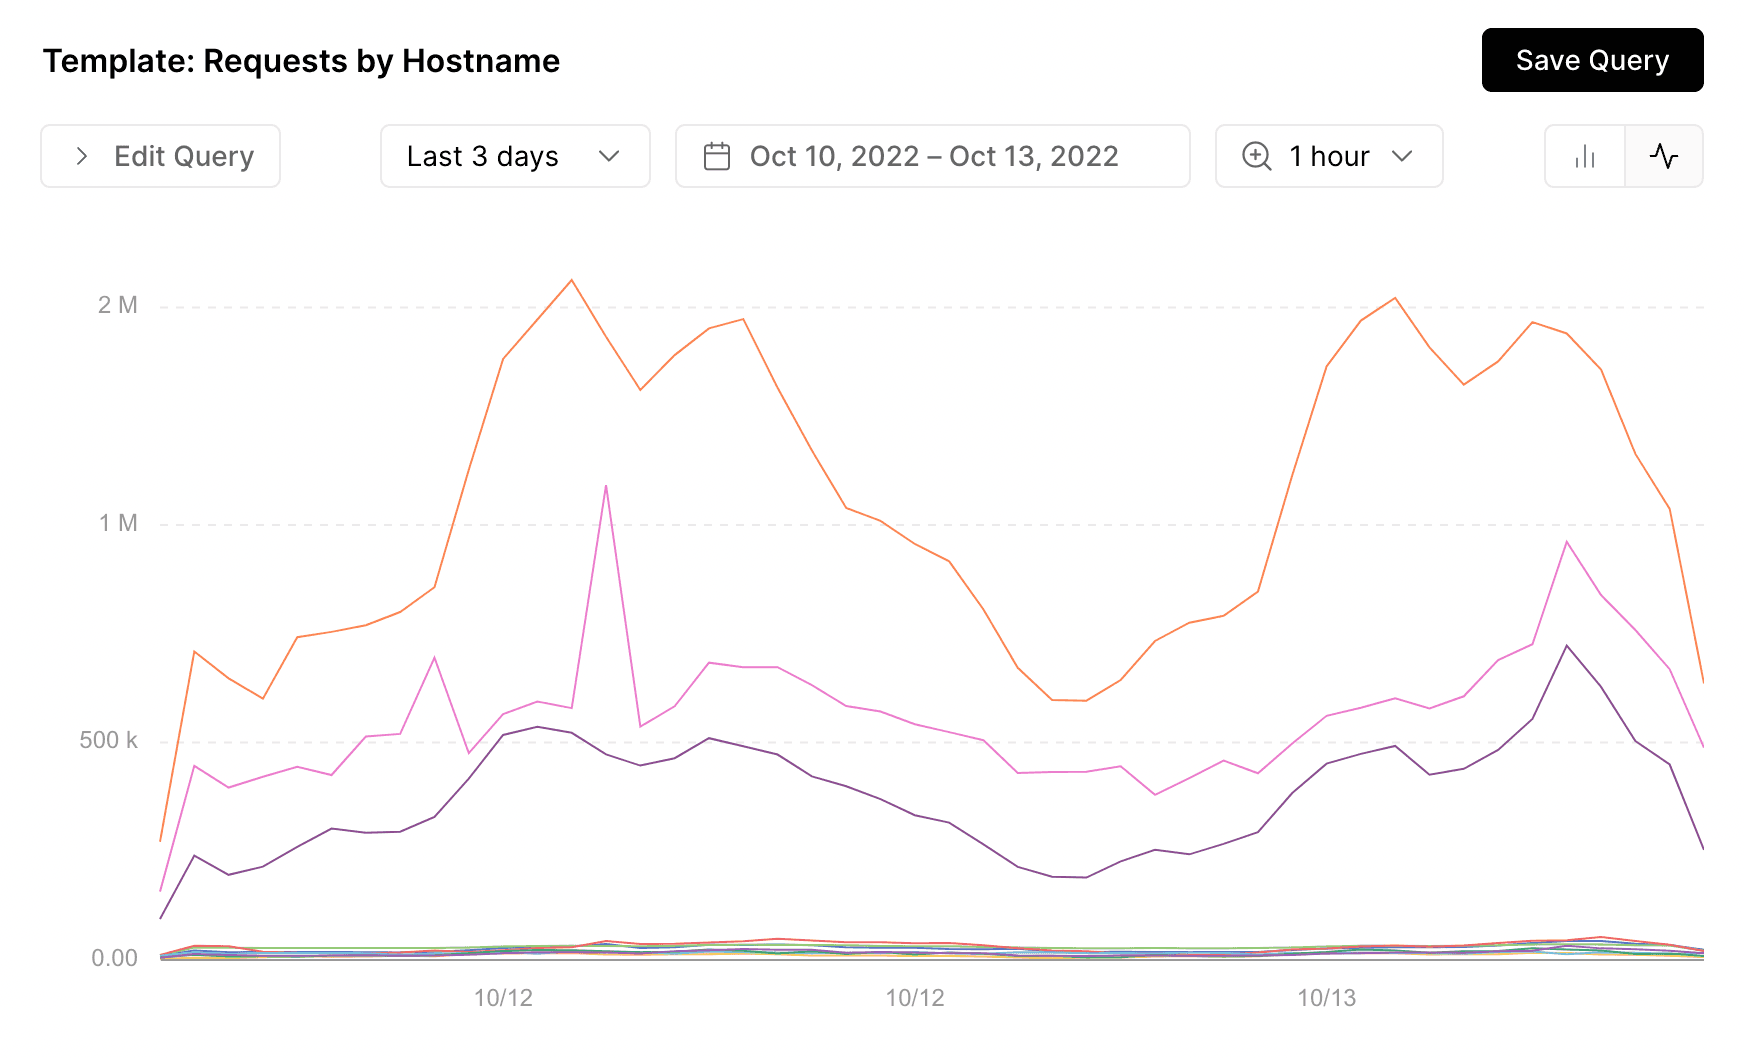
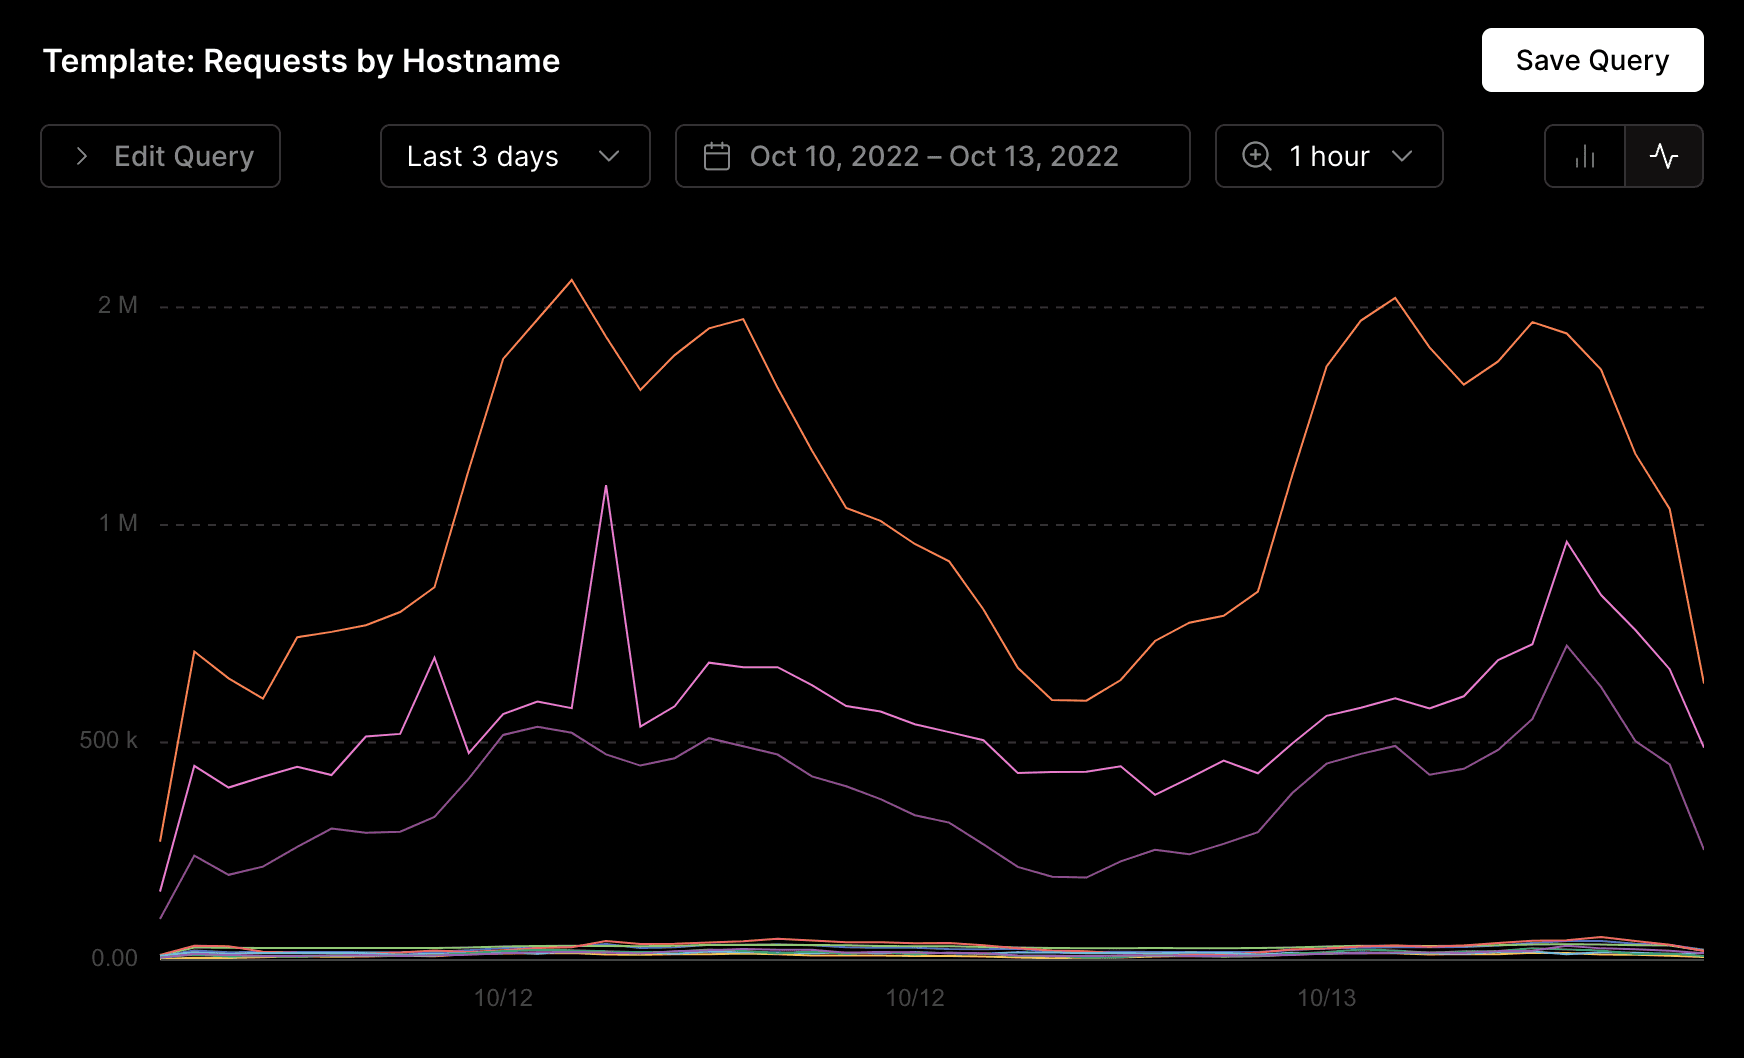
Hover and move your mouse across the chart to view your data at a specific point in time. For example, if the data granularity is set to 1 hour, each point in time will provide a one-hour summary.
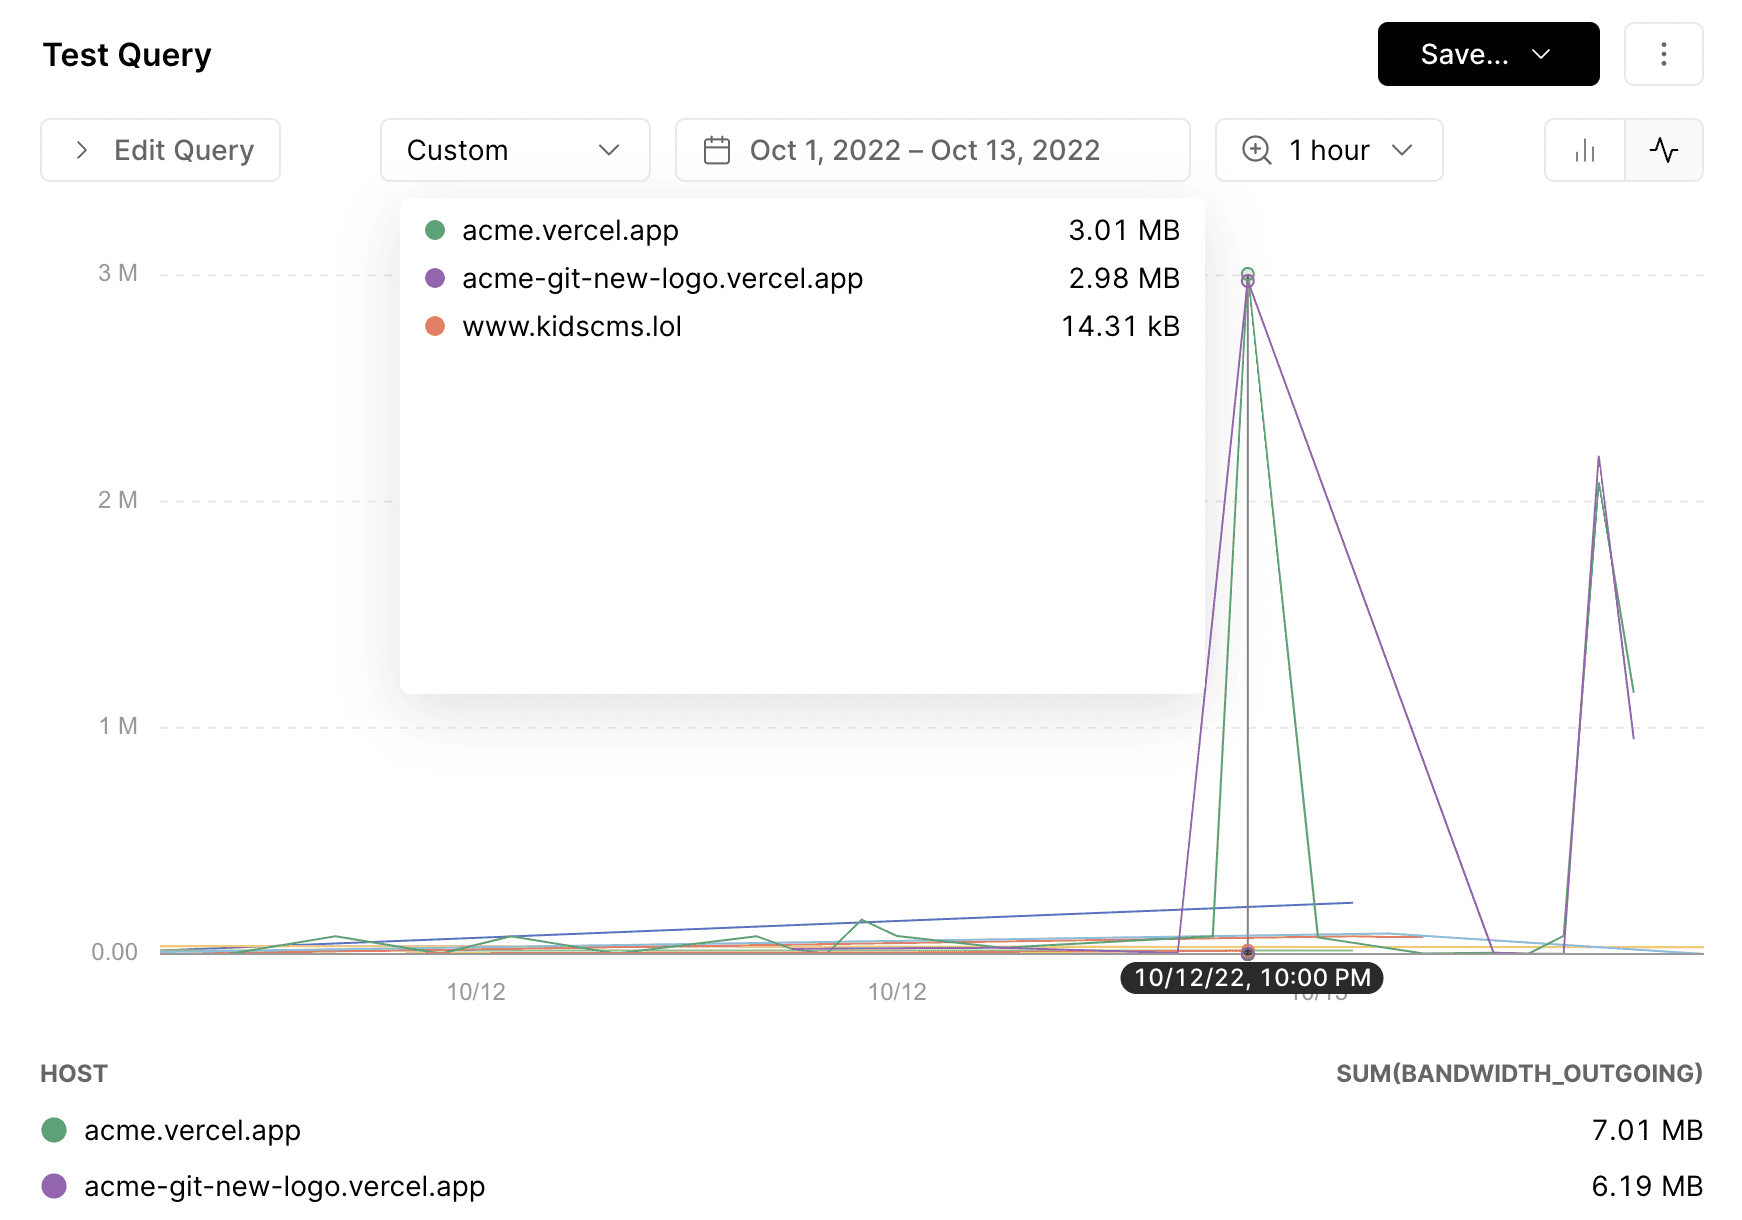
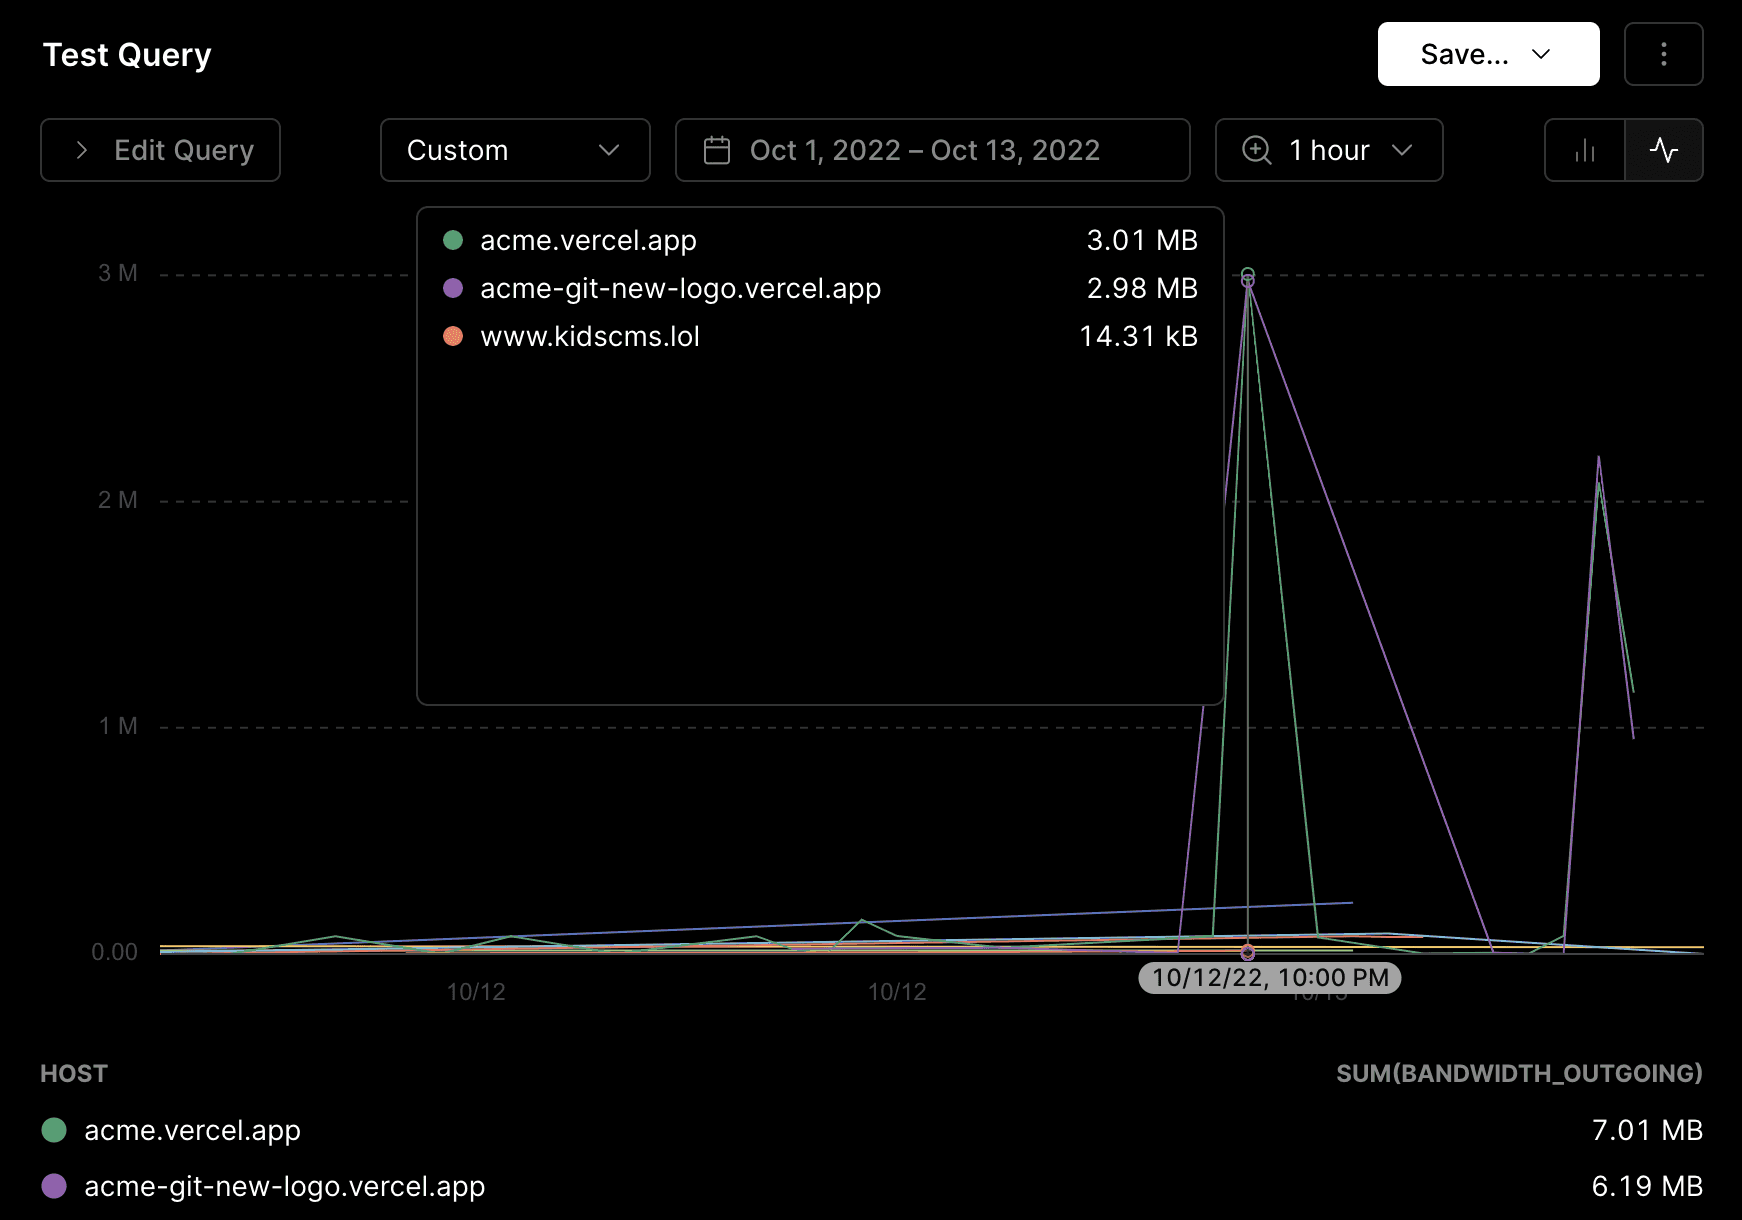
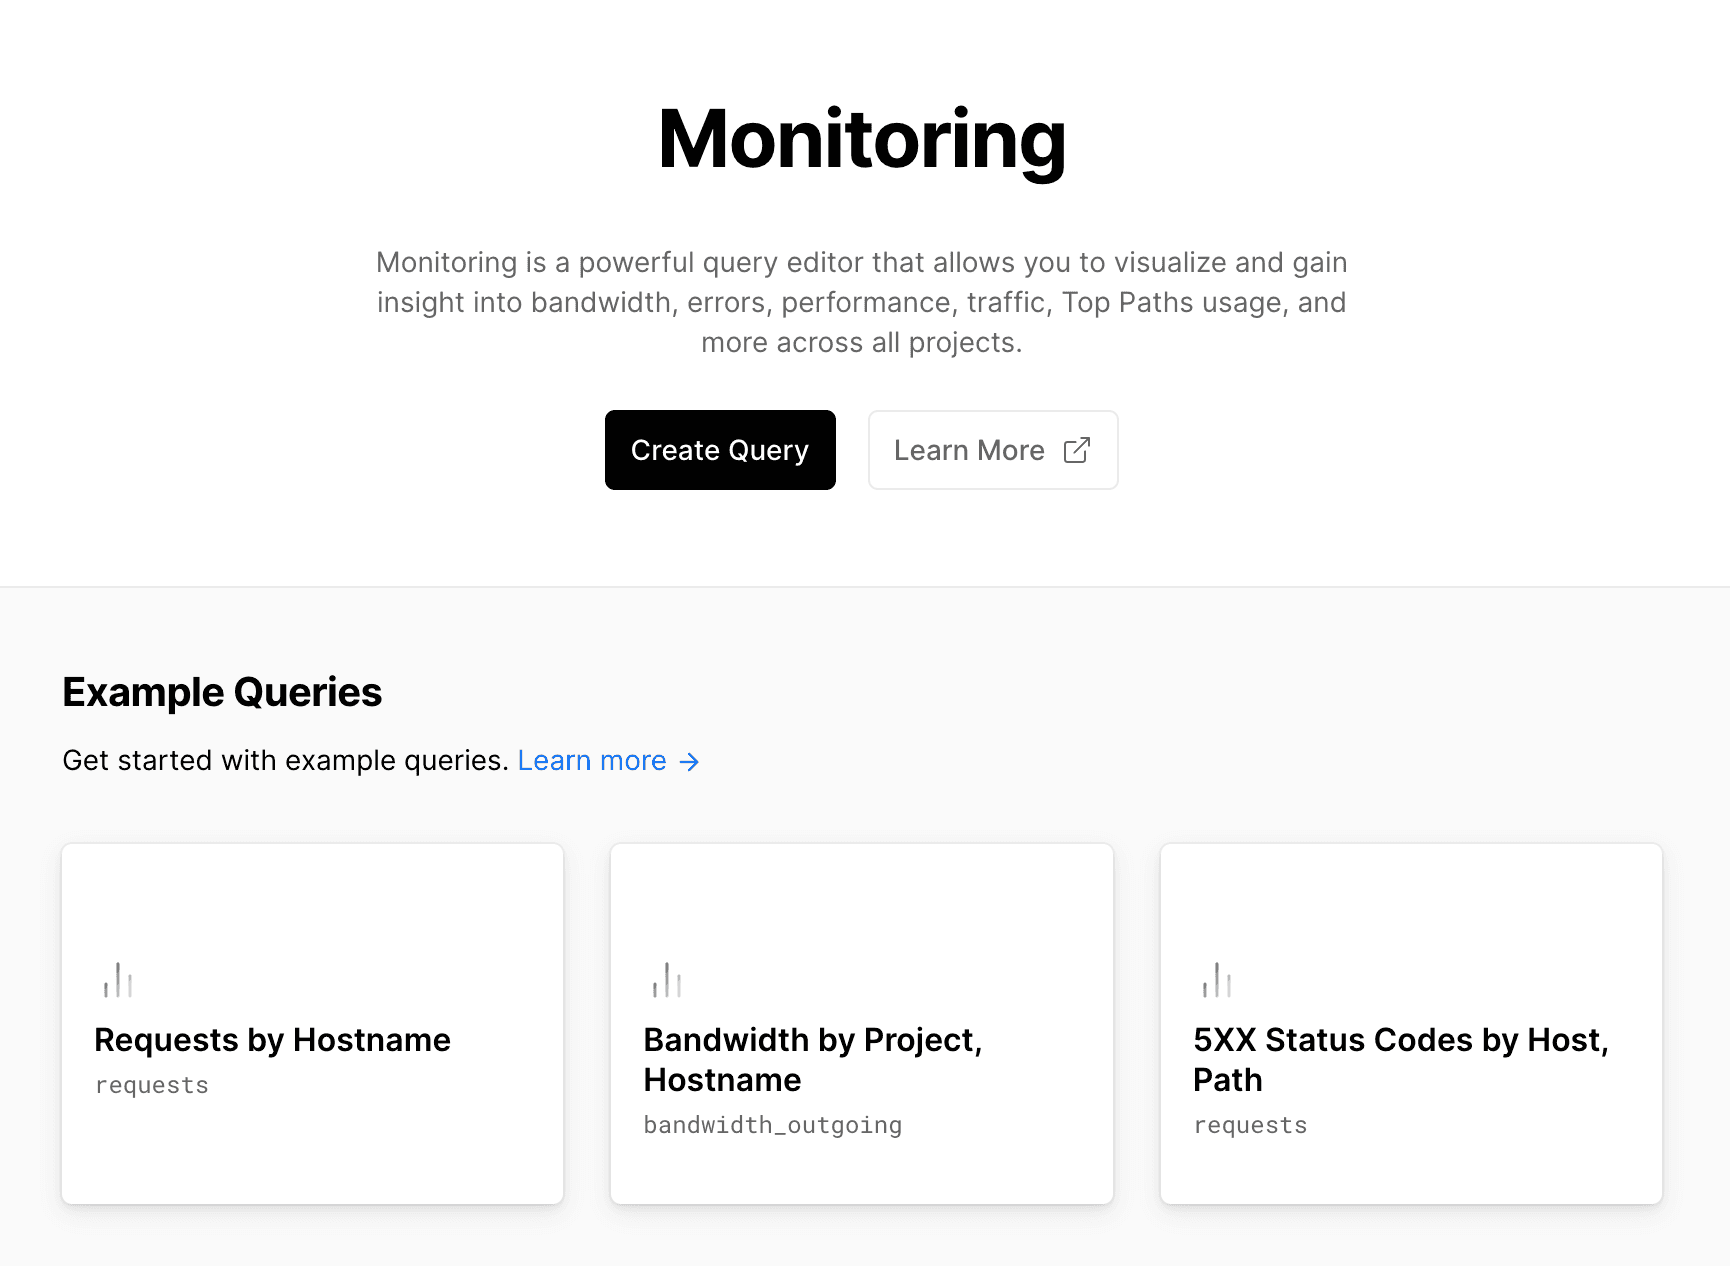
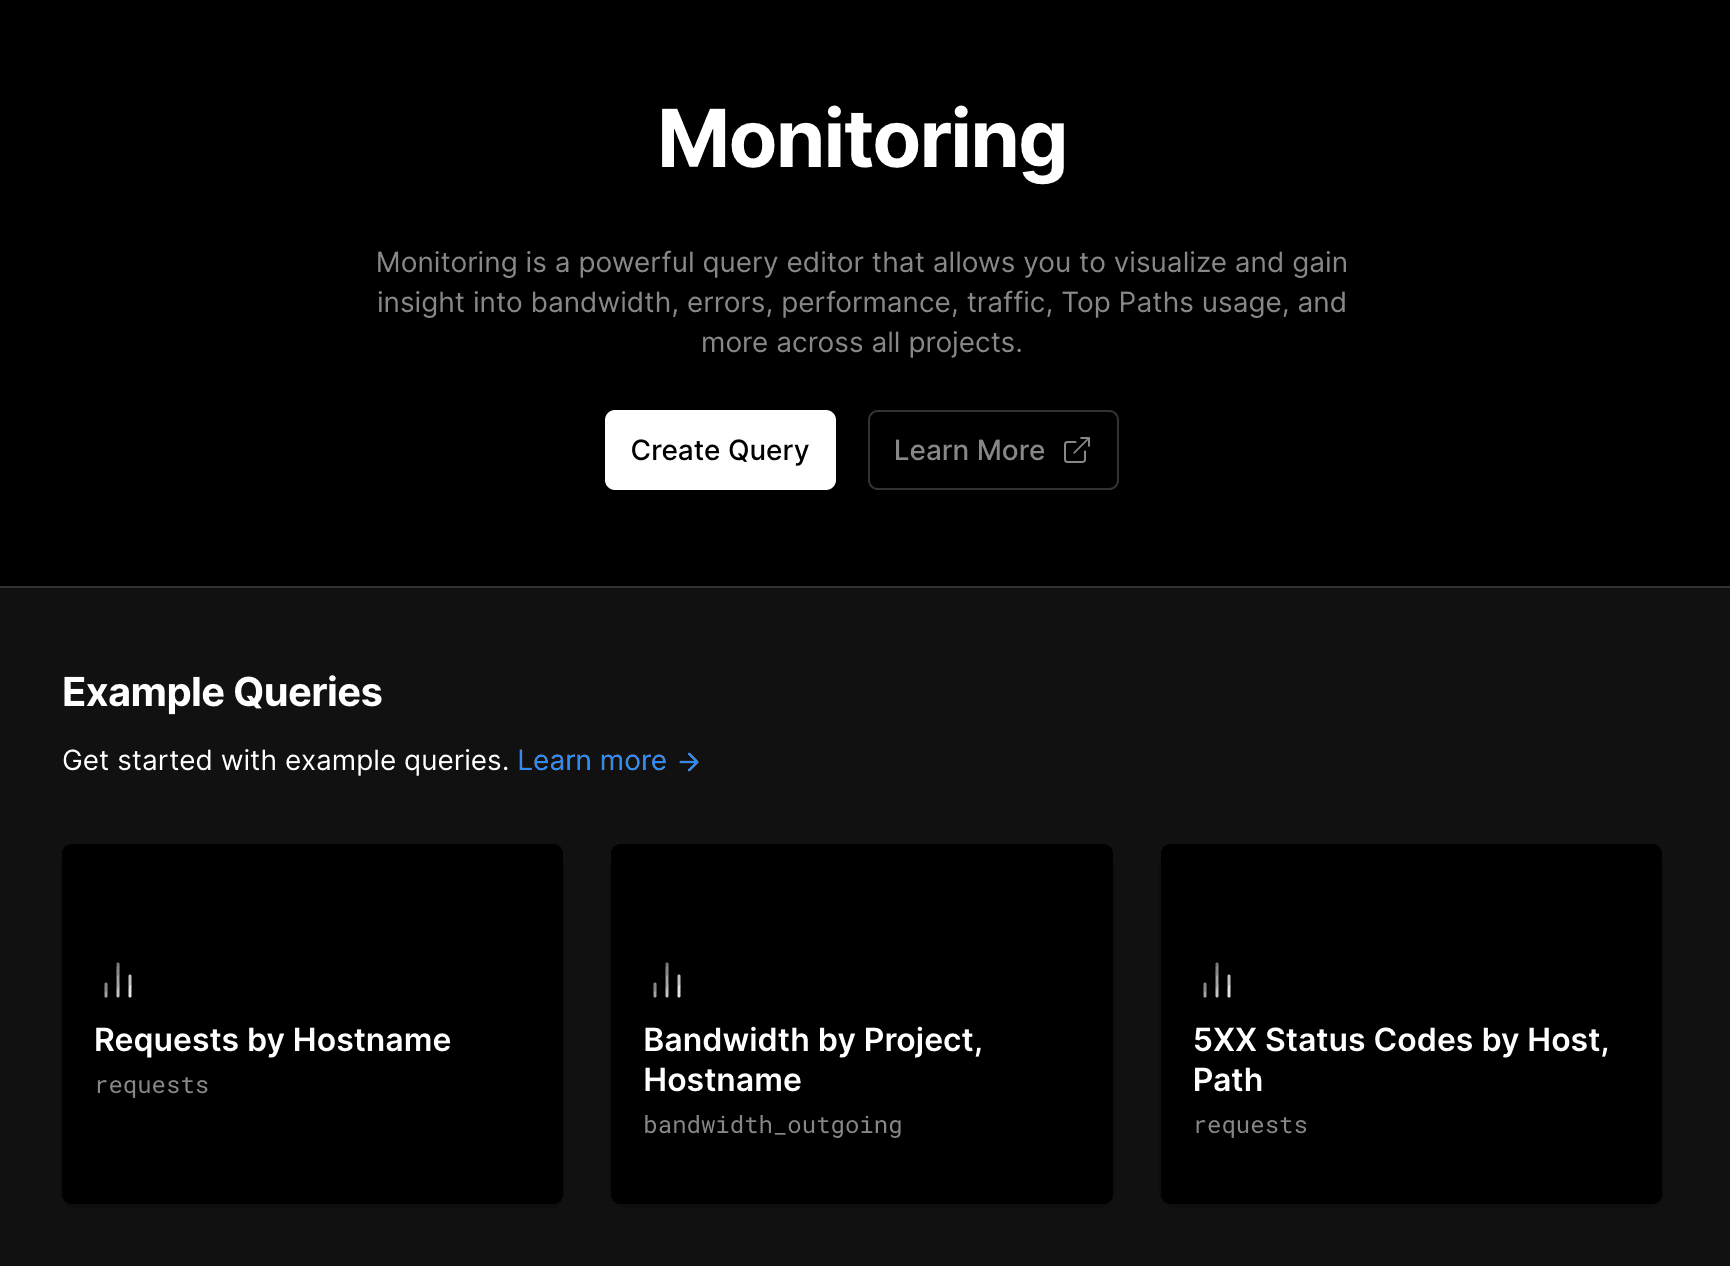
To get started with the most common scenarios, use our Example Queries. You cannot edit or add new example queries. For a list of the available options, view our example queries docs.
You can save either personal (My Queries) or Team Queries from the left navigation bar. Personal queries can only be viewed and edited by the user who created them. Only team members with the owner or member roles can access team queries.
You can manage your saved personal and team queries from the query console. Select a query from the left navigation bar and click on the vertical ellipsis (⋮) in the upper right-hand corner. You can choose to Duplicate, Rename, or Delete the selected query from the dropdown menu.


Alternatively, you can perform the same actions from the left navigation bar. Hover your mouse over a saved query and click on the vertical ellipsis (⋮) to view the drop-down menu.
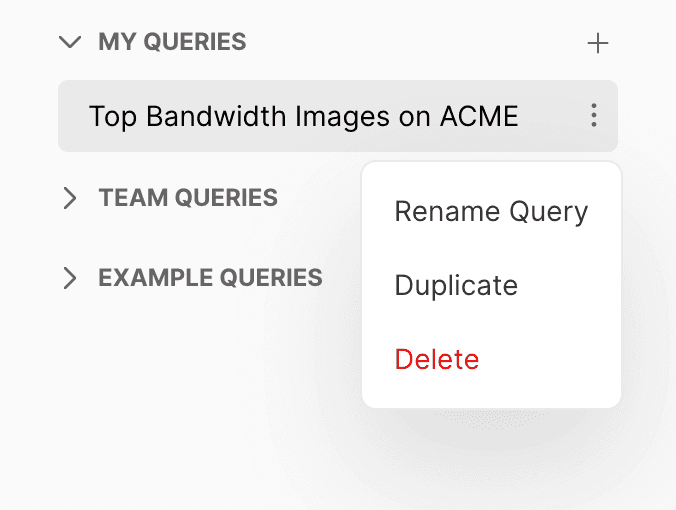
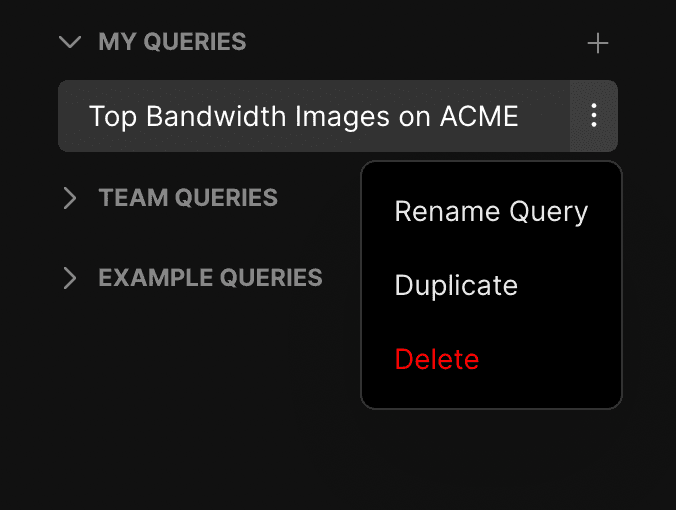
Manage individual queries from the sidebar right next to their names.
Duplicating a query creates a copy of the query in the same folder. You cannot copy queries to another folder. To rename a saved query, use the ellipses (⋮) drop-down menu or directly click its title to edit.
Deleting a saved personal or team query is permanent and irreversible. To delete a saved query, click the Delete button in the confirmation modal.
You may encounter errors such as invalid queries when using Monitoring. For example, defining an incorrect location parameter generates an invalid query. In such cases, no data appears.
To enable monitoring on Pro plans:
- Go to Monitoring tab from the dashboard
- Click Get Observability Plus and you see a confirmation modal
- Click Continue and then Confirm and pay to get access to both Observability Plus and Monitoring
Enabling and disabling Observability Plus are available on Pro plans
Those with the owner role can access this feature
Enterprise teams can contact sales to get a customized plan based on their requirements.
- Go to your team Settings > Billing
- Scroll to the Observability Plus section
- Set the toggle to the disabled state
Managing IP Address visibility is available on Pro and Enterprise plans
Those with the owner, admin role can access this feature
Vercel creates events each time a request is made to your website. These events include unique parameters such as execution time and bandwidth used.
Certain events such as public_ip may be considered personal information under certain data protection laws. To hide IP addresses from your Monitoring queries:
- Go to the Vercel dashboard and ensure your team is selected in the scope selector.
- Go to the Settings tab and navigate to Security & Privacy.
- Under IP Address Visibility, toggle the switch next to off so the text reads IP addresses are hidden in your Monitoring queries..
For business purposes, such as DDoS mitigation, Vercel will still collect IP addresses.
For a complete list of fields, see the visualize clause docs.
From Jun 20th, 2025, you will no longer be able to purchase Monitoring and use Save Query. If you want to continue using the full Monitoring capabilities or purchase a product similar to Monitoring, consider moving to Query.
- Enable Observability Plus to continue using query features.
- Save queries in Observability Notebooks.
For more information on what to do next, we recommend the following articles:
- Quickstart: Learn how to create and run a query to understand the top bandwidth images on your website
- Reference: Learn about the clauses, fields, and variables used to create a Monitoring
- Limits and Pricing: Learn about our limits and pricing when using Monitoring. Different limitations are applied depending on your plan.
Was this helpful?